As negotiations on President Biden’s Build Back Better plan continue, the spotlight is shining on a proposal by House Democrats to roll back the $10,000 cap placed on the state and local tax (SALT) deduction by the 2017 Tax Cuts and Jobs Act (TCJA). Opponents of the SALT deduction cap rollback claim that SALT primarily benefits those living in high-tax coastal and Northeastern states, while for most Americans living outside of these areas, SALT offers little more than a net loss in federal tax revenue. In response to these and other objections, Senate Democrats now seem poised to order Build Back Better with no SALT added. Are Democrats right to reverse course and hold the SALT?
As part of an ongoing project, I recently prepared estimates of the various income tax subsidies that homeowners receive, including the SALT deduction. I estimate that the TCJA cap placed on SALT deductions increased federal income tax revenue by approximately $48 billion in the 2018 tax year. The map below displays the increased benefit that homeowners would have received in that year if the TCJA SALT deduction cap were eliminated and replaced with the tax law that existed just prior to the TCJA.* The colors in the map correspond to quintiles of the distribution of increased income tax benefits per homeowner from a SALT deduction cap repeal, with darker blues corresponding to higher tax benefits per homeowner.
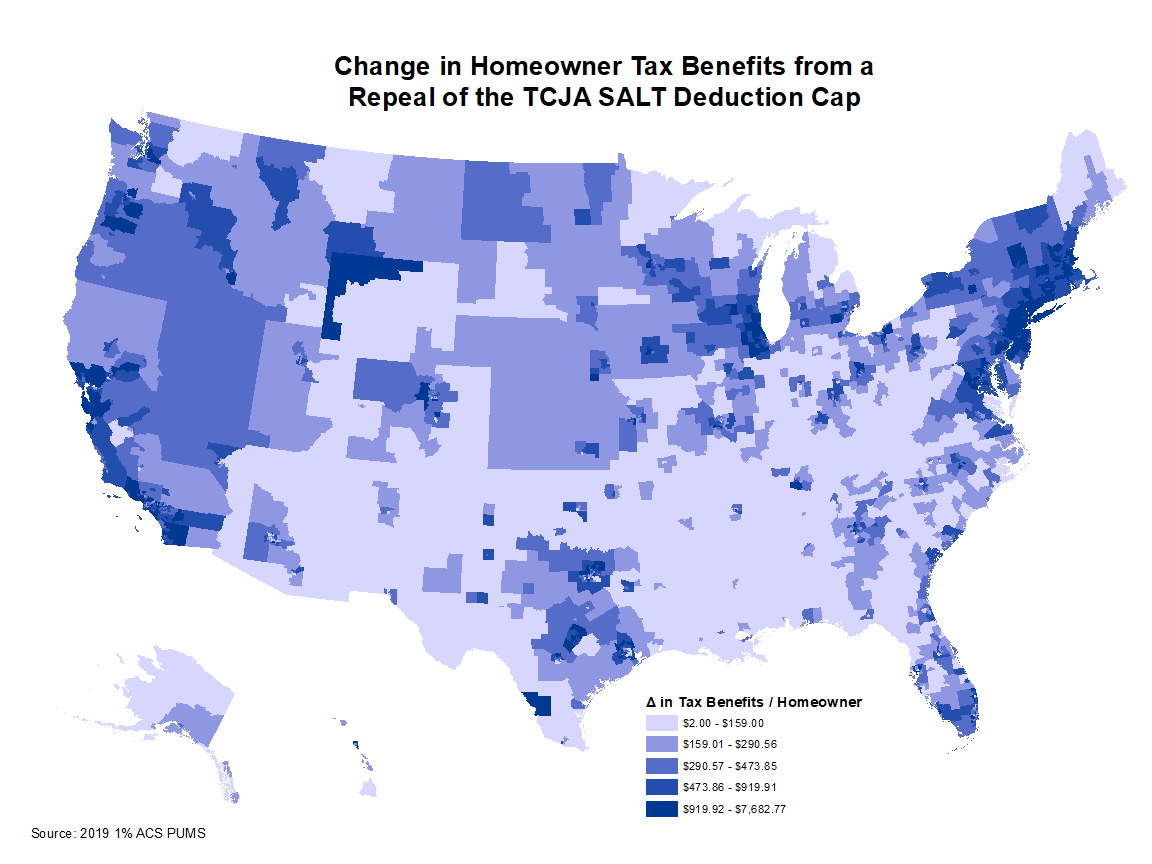
As this map shows, most of the benefits from eliminating the SALT deduction cap would accrue to households living in the Northeastern Corridor, metropolitan areas surrounding Chicago, and coastal metropolitan areas in Florida and on the West Coast. Homeowners living in high-amenity, high-housing price regions such as Jackson Hole, Wyoming – along with homeowners living in areas with high local property tax rates such as the Texas Triangle – would also receive large tax benefits. Some Republicans have characterized Democrats’ SALT deduction cap reform proposal as a windfall that would only benefit those living in high-tax Democratic states, but this map suggests that many homeowners living in states that voted for Donald Trump in the last presidential election, such as Texas and Wyoming, would also receive large benefits. The primary beneficiaries of any SALT deduction cap repeal are those living in areas with high housing prices and/or high state and local tax rates.
This analysis does not consider the impacts of the various alternatives to a full repeal of the TCJA SALT deduction cap being considered by House Democrats, but it does suggest that any move to scale back the SALT deduction cap will likely exacerbate geographic disparities in the distribution of housing-related tax benefits.
* I prepared these estimates using the National Bureau of Economic Research TAXSIM microsimulation model with input data from the Census 2019 1% Public Use Microdata Sample (PUMS). The sample identifies households by PUMS-defined geographies known as Public Use Microdata Areas (PUMAs), which enables me to map the geographic distribution of various homeownership tax subsidies. Stay tuned for a forthcoming paper that describes the methodology in more detail.
