I’ve been digging through the 2020 Census Redistricting Data, and the population changes by race and ethnicity in Portland, Oregon, fascinate me. Figure 1 displays the percentage of nonwhite persons (those not identifying as non-Hispanic white alone) by census tract in 2010 (left) and 2020 (right). The 2010 Portland Urban Growth Boundary (UGB) is in blue, and Portland’s 2010 municipal boundaries are in red. The census tracts identified by Lisa Bates (2013) as being “at-risk” of gentrification (susceptible, early type-1, or early type-2 gentrification), based on 2010-2015 neighborhood changes, are highlighted in green.
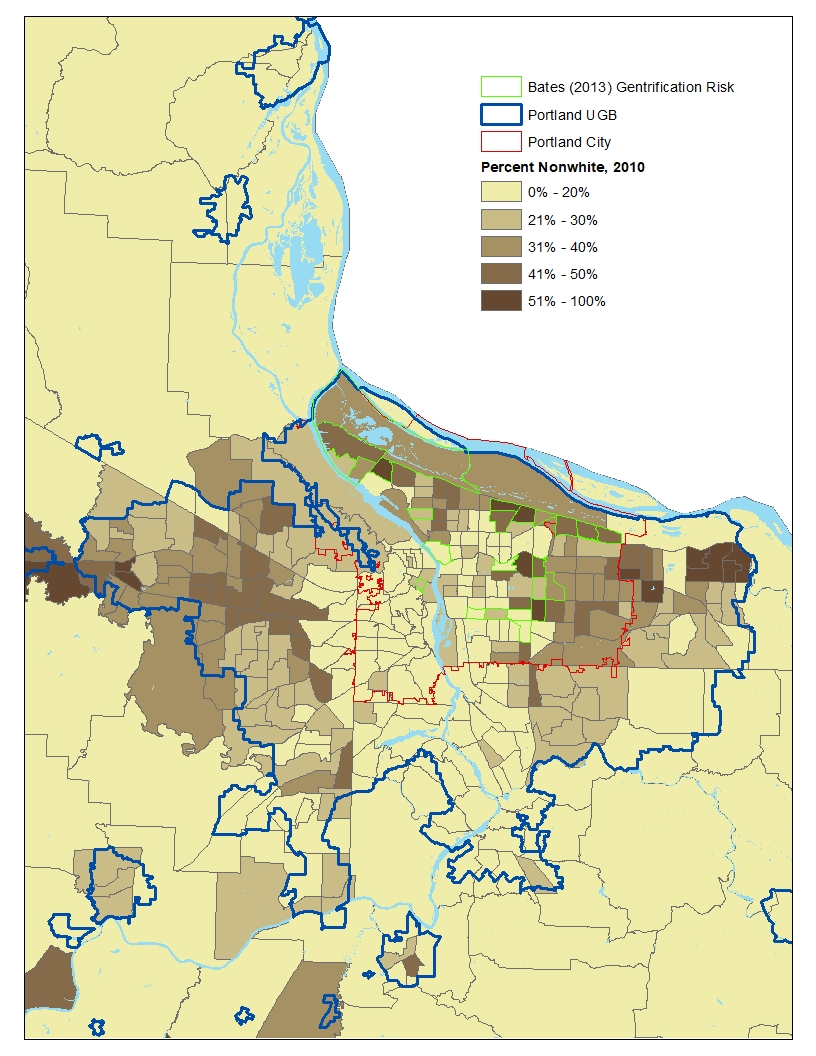

Figure 1
For many, Portland has become the posterchild of gentrification. Yet, these maps suggest that during the 2010-2020 period, gentrification was less pervasive than is typically perceived (if we define gentrification as a reduction in a neighborhood’s share of nonwhite residents). Other than a few of the neighborhoods along Interstate 205, most neighborhoods at-risk of gentrification actually saw increases in the percentage of nonwhite residents. Moreover, large swaths of the city, including downtown, saw increases in the percentage of nonwhite residents.
Also interesting is the relationship between Portland’s UGB and patterns of neighborhood change. By 2020, most census tracts outside the city but within the UGB saw increases in nonwhite percentages. Importantly, because a large number of 2020 tracts exhibit a racial composition that closely approximates Oregon’s portion of the larger Portland-Vancouver-Hillsboro, OR-WA metropolitan area (32 percent nonwhite), 2010-2020 racial transitions did not exacerbate regionwide patterns of racial segregation. White / nonwhite segregation within Oregon’s portion of the larger metropolitan area, as measured by the dissimilarity index, declined during the 2010s from 28 to 24 (a 13 percent decline). These findings are consistent with Nelson, Dawkins, and Sanchez (2004), who found that during the 1990s, metropolitan areas with urban containment policies such as Portland’s witnessed greater reductions in racial segregation than those without.
Breaking down the nonwhite population data by race and ethnicity reveals interesting spatial patterns for Black (those identifying as Black alone or Black plus any other race) and Hispanic (those identifying as Hispanic or Latino) persons. Figure 2 duplicates Figure 1 but replaces “nonwhite” with “Black.” Figure 2 displays different breakpoints for the racial composition categories to reflect the fact that few Black persons reside in the greater Portland metropolitan area.
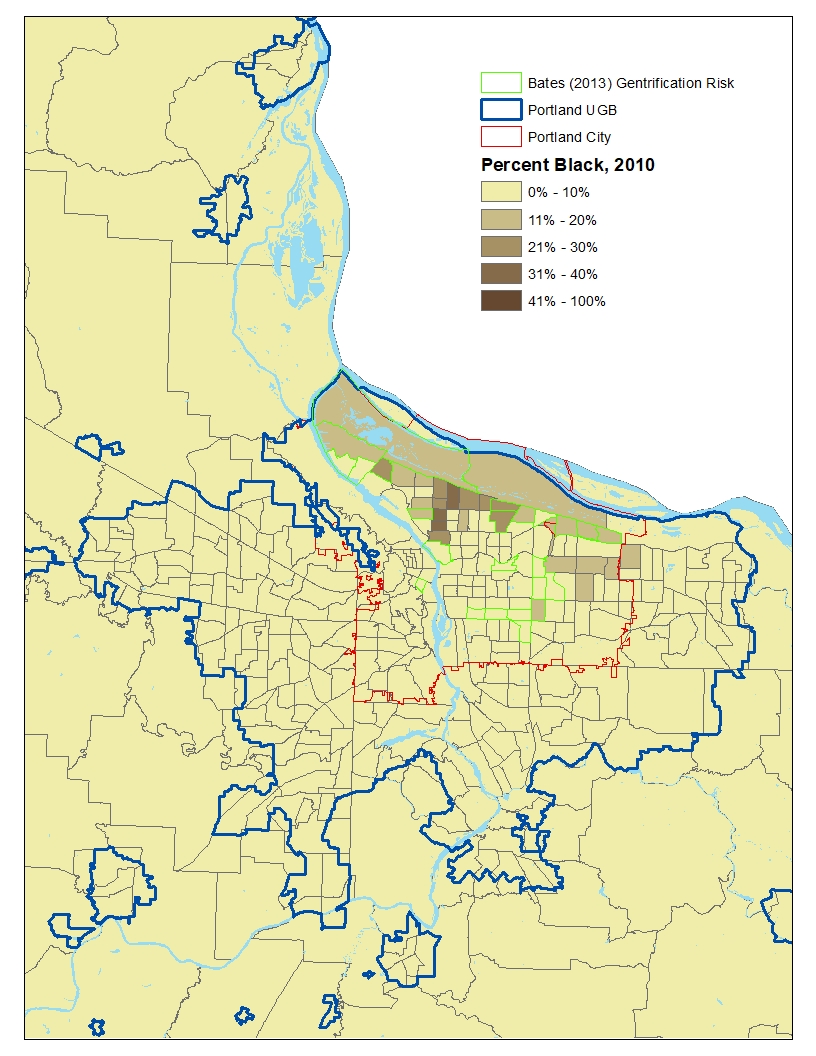

Figure 2
Figure 2 paints a more nuanced picture of racial change. Overall, the Black population’s share declined in NW Portland and increased in SE Portland. Two census tracts farther from the city’s core saw increases in Black population shares. Of the neighborhoods initially at-risk of gentrification, two dropped to a lower Black population share category, while one rose to a higher Black population share category.
Figure 3 displays patterns of ethnic change for those identifying as Hispanic or Latino. These maps rely on the percentage categories displayed in Figure 1 to reflect the larger number of census tracts with high percentages of Hispanic persons.

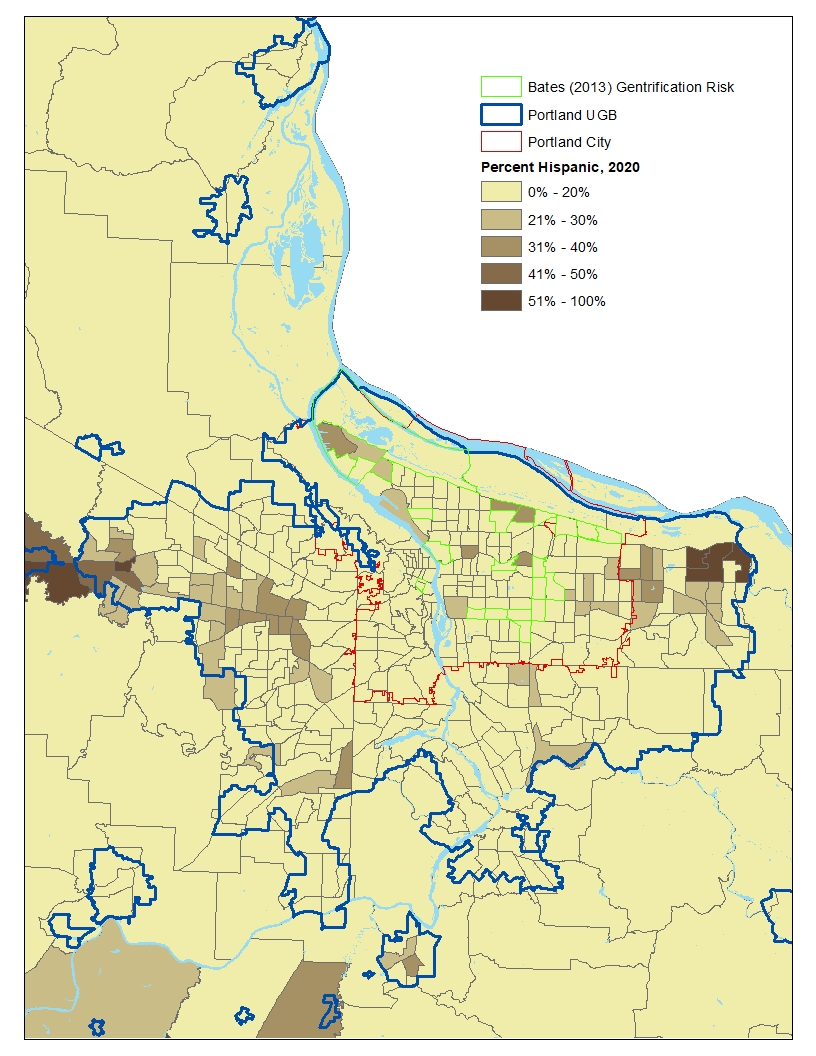
Figure 3
Figure 3 suggests that Hispanic residents suburbanized and spread out between 2010 and 2020. Hispanic residents expanded into neighborhoods west of the city, while the area in NE Portland occupied by Hispanic residents shrunk in size over the decade.
This preliminary analysis suggests that other than a few isolated pockets of gentrification that affected Hispanic and Black residents in different ways, Portland has been fairly successful in slowing gentrification within many neighborhoods that were initially at-risk of becoming majority white.
I am curious to hear from Portland residents, scholars, and activists to see how these aggregate statistics compare to changes observed on the ground.

Good post Casey! I’ll be interested to see more of your census exploration. My #1 question has to do with changes in population density at the tract level. Since the %s change in some tracts because of changes in the total population, it would be interesting to see areas of growth overall (and decline, if any) and how that differs across racial groups. Looking at population density change (total and by race) would be a natural follow-up, especially considering the goals of the UGB.
A second question is about how the population identifying itself as white has changed. You’ve probably seen the big increase in white people who self-identify as multiracial from 2010 to 2020; many more people claimed to be both white and American Indian in 2020 than was the case in 2010. I haven’t dug into the data enough to know how the combinations of racial self-ID + Hispanic or Latino self-ID have shifted. Also, over the past 20 years or so, the % of Hispanic/Latino people self-identifying as white on the long form (2000) and ACS has increased while the % self-identifying as “some other race” has declined. Given the big growth in the Hispanic/Latino population, it could be fruitful to explore the responses to the race question of people who self-identify as Hispanic/Latino.
LikeLike
These are great comments, Rolf. Regarding your first question, I haven’t looked at this yet, but it should be easy enough to calculate. Stay tuned for an updated post that looks at population density!
I had the same thought about your second question. Due to changes in the Census question format, it may not be possible to know if changes in the “other race” category (races other than white, Black, Hispanic) were driven by changes in self-identification, but I hope someone takes up this challenge. I suspect that we’ll see tract-level changes in many metropolitan areas that are due to changes in how people self-identified in 2020 compared to 2010 when the question was posed differently. The challenge will be how to “net out” these changes from actual changes due to population mobility.
LikeLike